As part of the performance investigation for Australis (the in-progress Firefox desktop redesign), we wanted to be able to easily track Talos performance benchmark numbers across all of the relevant platforms without having to open 52 graph server links (Datazilla wasn't ready at the time) . My goal was to use the graph server API to pull in the data and display the regression percentage for all of the tests we were tracking in an overview. Rather than writing a new tool from scratch, I decided to look into Google Apps Script, which I had only heard about before, and it seemed to be able to help implement what I wanted on top of Google Spreadsheets. The result is a shared Talos Google Apps Script Library [Google login required] (revision log) (API docs) that anyone can use. You can see it in use for TART and other tests for Australis along with the demo spreadsheet.
How to use the Talos library in a Google spreadsheet
Also see Google's documentation on Libraries and the demo spreadsheet.
- In your Google Spreadsheet, choose Tools > Script Editor
- In the new tab, click Close to skip the tutorials and templates.
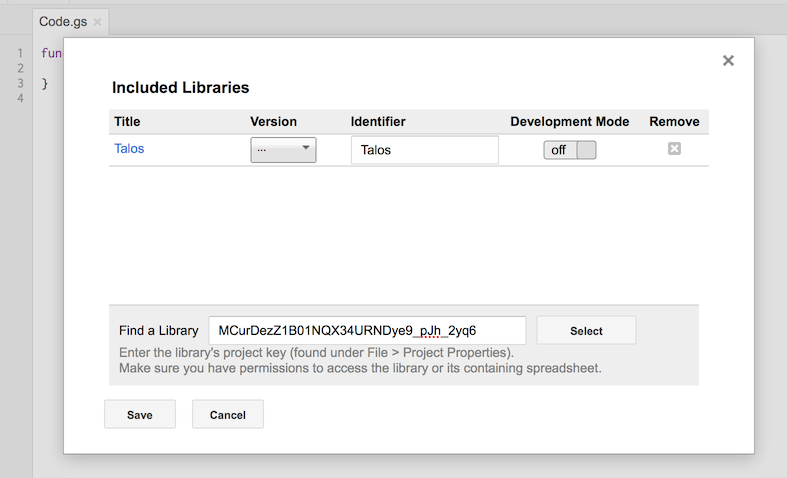
- In the menu, choose Resources > Manage Libraries. If you are asked to save your project, do so.
- In the "Included Libraries" window, paste the following in the "Find a Library" textbox and click Select: MCurDezZ1B01NQX34URNDye9_pJh_2yq6
- The "Talos" library should have appeared above. Choose a version of the library (the latest is probably best), and click Save.
- Replace the contents of the default script file ("Code.gs" at the time of writing) with pass-through wrappers for every function you want to use (example). Let me know if there is a better way to do this as it's not ideal.
- Call your wrapper functions from within your spreadsheet. e.g.
=getTalosResult(226, 59, 25, "ca7577238ef4"). You can get test, branch and platform IDs from the compare.py script or from the URLs output on TBPL.
Now you can use the power of spreadsheets to slice and dice the data as you please. Perhaps you like custom graphs?
Caveats
- Google seems to cache return values of functions for given arguments and so you should only only request results when the talos runs are done and have as many re-triggers as desired. Otherwise, you'll need to change one of the arguments to the functions or add a new cache-breaker argument.
- Occasionally you will get an error that the script took too long to execute. I haven't found documentation on what the upper bound is and I'm not sure of the cause but since there is caching in the library as well, recalculating the whole document within the script's cache period (currently 12 minutes) normally allows the scripts to finish since many of the rows and/or columns can use the cached data.
Eventually the library should switch to using Datazilla but this works for now since talos results are being reported to both services. If you would like to contribute changes to the library, let me know.
 Software developer at Mozilla on the Firefox team.
The limit is 5 or 6 minutes,
The limit is 5 or 6 minutes, I can never remember.
Member for
16 years 8 monthsIt feels more like one or two
It feels more like one or two minutes of clock time so maybe you are talking about a different limit?