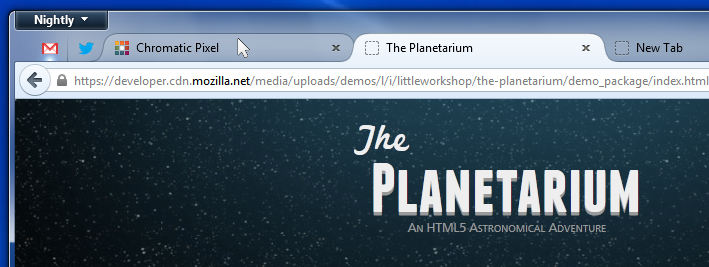
As part of the performance investigation for Australis (the in-progress Firefox desktop redesign), we wanted to be able to easily track Talos performance benchmark numbers across all of the relevant platforms without having to open 52 graph server links (Datazilla wasn't ready at the time) . My goal was to use the graph server API to pull in the data and display the regression percentage for all of the tests we were tracking in an overview. Rather than writing a new tool from scratch, I decided to look into Google Apps Script, which I had only heard about before, and it seemed to be able to help implement what I wanted on top of Google Spreadsheets. The result is a shared Talos Google Apps Script Library [Google login required] (revision log) (API docs) that anyone can use. You can see it in use for TART and other tests for Australis along with the demo spreadsheet.
